RecordBreaker Malware Analysis, Part 1
RecordBreaker malware (AKA Raccoon Stealer V2) is reported to be a "full rewrite in C/C++" of Raccoon Stealer. The Racoon Stealer malware family is an MaaS (Malware as a Service) "product" available for sale in online black markets that is primarily reported to be a password/credential stealer.

RecordBreaker malware (AKA Raccoon Stealer V2) is reported to be a "full rewrite in C/C++" of Raccoon Stealer. The Racoon Stealer malware family is an MaaS (Malware as a Service) "product" available for sale in online black markets that is primarily reported to be a password/credential stealer.
The sample I'm analyzing in this writeup is from Malware Bazaar, and was originally uploaded by Malware Bazaar's primary account from Abuse.ch. Analysis is being conducted on an isolated lab VM that DOES have a connection to the internet, but I will disable the virtual NIC when needed prior to behavioral or dynamic analysis.
This is going to be a multi-part writeup, both because I don't want to post something that takes over half an hour to read in additional to me also working towards my OSED certification at the moment.
This sample is a 32bit natively compiled PE format executable. I need to work on my x86 assembly reverse engineering for the OSED exam anyway, so that's my justification for taking some time away from the Offensive Security labs to tackle this sample.
Disclaimer Dec 14 2022: At the original time of writing this series (August 2022) the tool PEStudio used the term "blacklisted" to point out various items that were deemed suspicious. Since then, the dev team for PEStudio has updated their tool to use the term "Flagged" as a replacement for "blacklisted". If following along/reading this writeup at a date later than August 2022, your copy of PE studio likely uses the term "Flagged".
Initial Static Analysis
I already mentioned in the intro that the sample is a c/c++ rewrite of Raccoon Stealer and is 32bit. It appears to have been compiled with Microsoft's Visual Studio c++ compiler.
Exeinfo PE doesn't think the file is packed, however given it's 862 KB size (and >70% of that is in the .text code section), and that it only has listed imports from User32.dll and Kernel32.dll, I'm betting more is going on here. It will likely unload additional stages at runtime, have some padding/junk code, and/or dynamically load additional libraries.
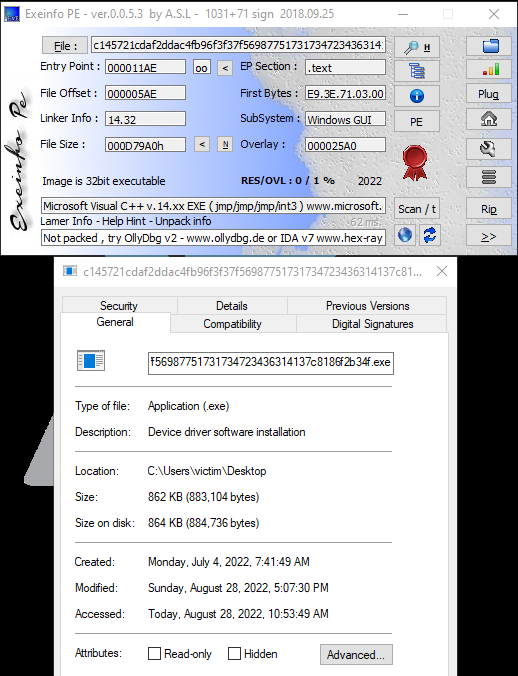
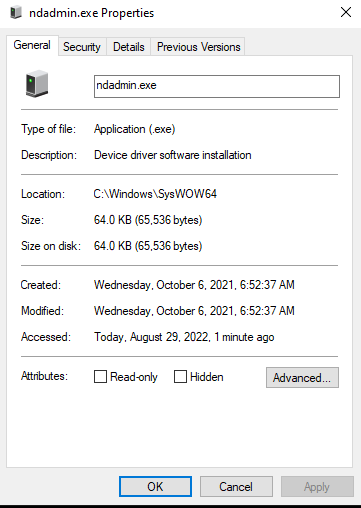
Moving on to PEStudio's automatic analysis output, something jumps out pretty quickly when checking the file out - it's masquerading as a Microsoft device driver installer originally named "NDAdmin.EXE". The real ndadmin.exe resides in C:\Windows\SysWOW64\ and is only 64kb in size.
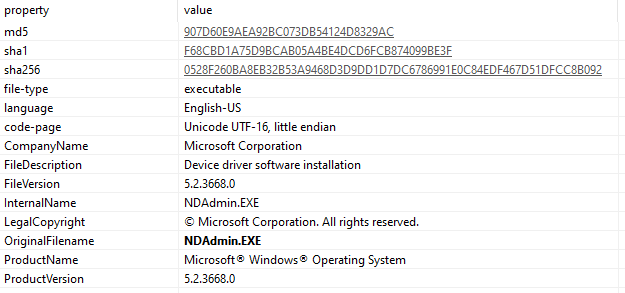
It even has a fake digital signature that fails to validate. For comparison, I've included the cert information from ntoskrnl.exe on my lab machine (the real ndadmin.exe isn't signed).
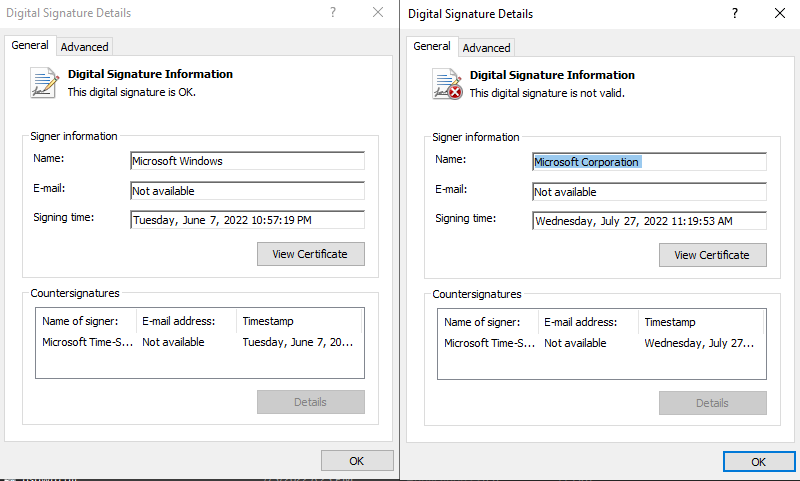
Details vary between them:
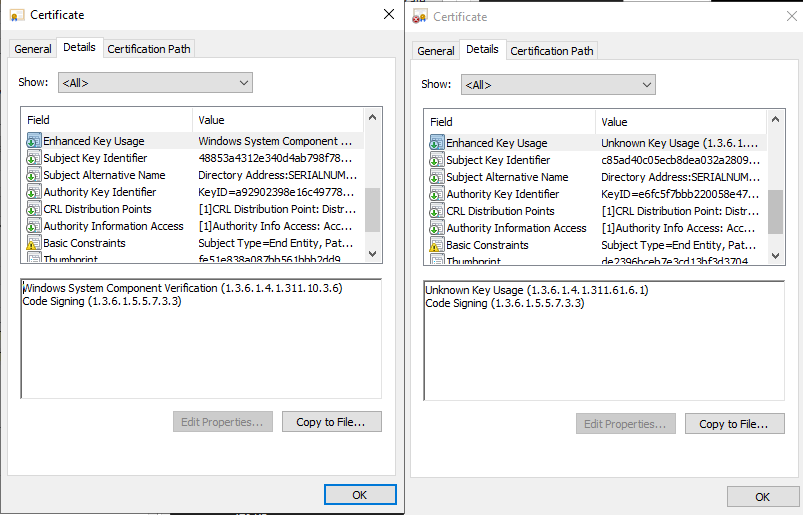
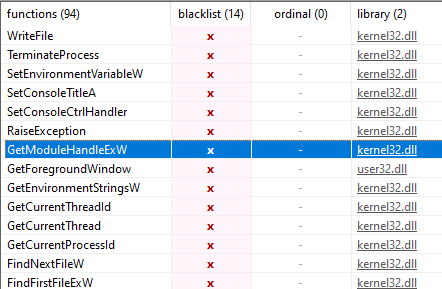
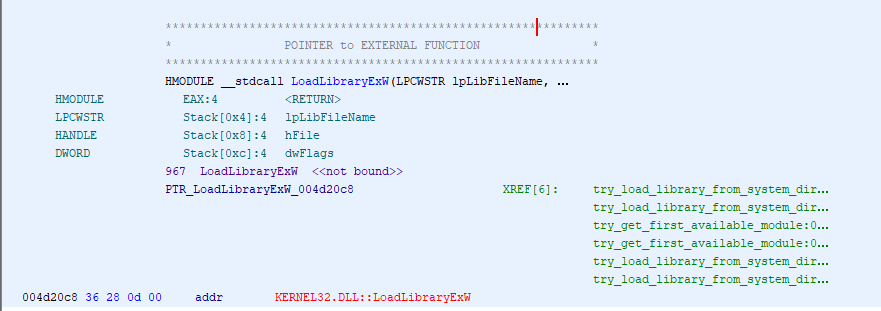
Moving on, there's nothing that jumps out in the resources or strings output; the blacklisted strings all match up the function imports. The functions loaded contain some additional hints that it will load the rest of it's libraries dynamically at runtime. It imports LoadLibraryExW to load libraries, GetModuleHandleExW to get a handle of the loaded libraries, and GetProcAddress to find functions within them. It also imports some functions that PEStudio has blacklisted as well as CreateFileW and WriteFile which means it may drop an additional stage or some file for persistence.
There's nothing for communication (as stated before it only loads User32.dll and Kernel32.dll) and no encryption libraries being loaded. There are read and write file operations, process manipulation imports, etc.
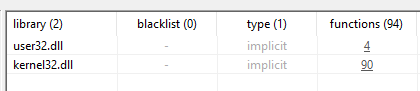
The library table screenshot, for reference.
Nothing in the sections jumps out, though PEStudio doesn't like the CFG section, but exeinfope already identified the compiler as Visual C++, which automatically adds this section in newer versions. Control Flow Guard is an anti-exploit system from Microsoft targeting memory corruption vulnerabilities such as stack/buffer overflows targeting EIP and SEH overwrites.
"Control Flow Guard (CFG) is a highly-optimized platform security feature that was created to combat memory corruption vulnerabilities. By placing tight restrictions on where an application can execute code from, it makes it much harder for exploits to execute arbitrary code through vulnerabilities such as buffer overflows. CFG extends previous exploit mitigation technologies such as /GS, DEP, and ASLR."
In other words, I'm not worried about it despite PEStudio having it blacklisted.
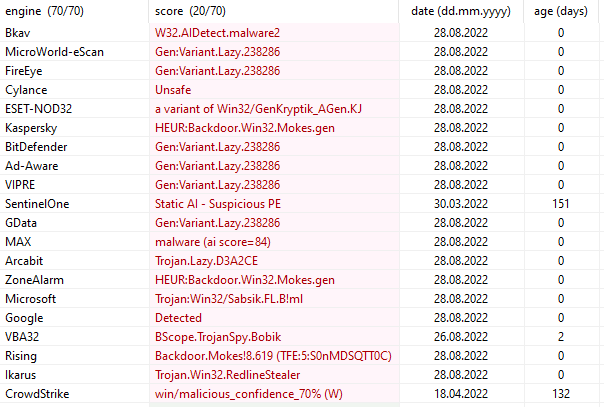
Skipping ahead to the VT (Virus Total) results that PEStudio automatically pulls, it has a 20/70 hit rate.
This quick initial static analysis gives me some expectations as to what I'll see during dynamic code analysis. Specifically, I'm expecting it at some point to decode/decrypt an additional stage and save it as a file - rather than just in memory - prior to executing it.
Finding The Real Payload
Trying to find the hidden payload with dynamic code analysis and reverse engineering.
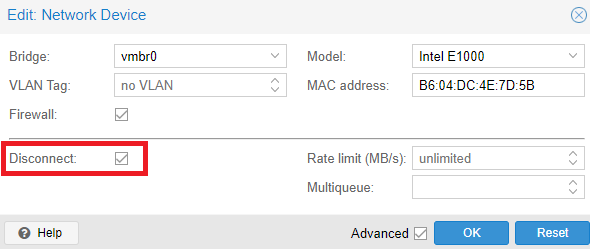
To start, I set the virtual NIC to disconnected in the hypervisor (ProxMox). I don't want the sample to be able to connect to any C2 if I don't have to. I also want to deny the malware a chance to re-enable a disabled adapter in Windows. Since I'm actually disabling the virtual hardware from the VM the malware sample would have to escape it to get out anywhere.
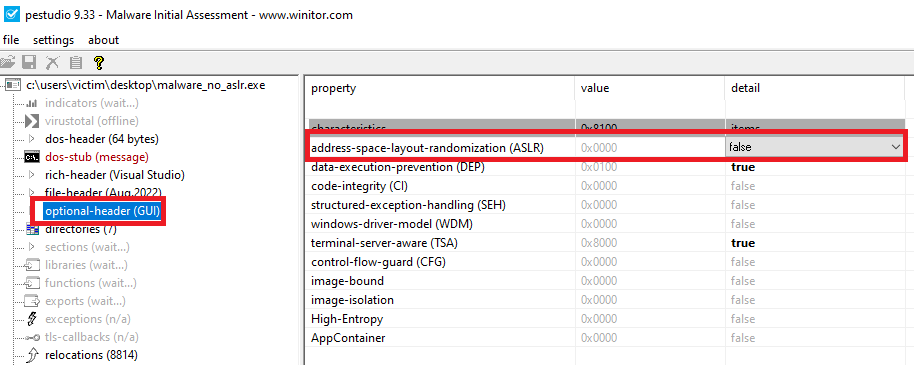
Second, I'm going to disable ASLR for the executable to make it easier to compare between the live debugger and more code-oriented reverse engineering tools like Ghidra and IDA free.
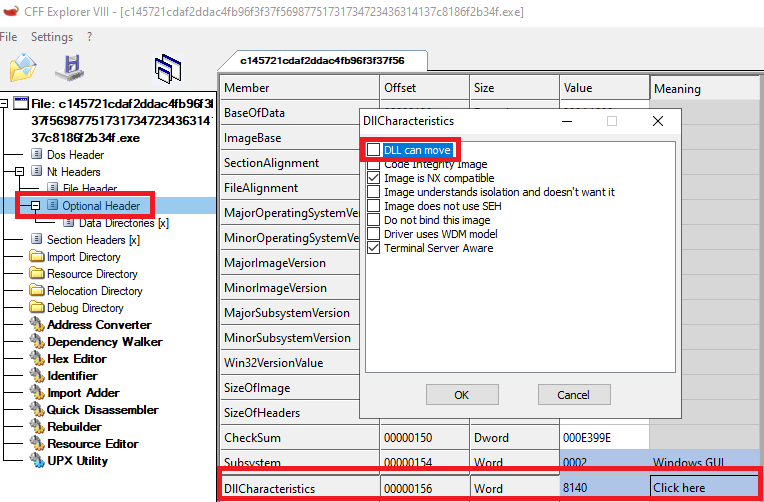
You can also do this with PEStudio rather than CFF Explorer like I did.
You have to save the file manually after using either tool. In my case I saved it as "malware_no_aslr.exe".
Next, I'm going to load it up in IDA/Ghidra and let them run their automatic analysis. I prefer IDA's function flow chart when analyzing assembly (and it's required to use for OSED so I need more practice - Ghidra is banned on the exam), however Ghidra's C decompiler can be a great help when trying to figure out where to look. The decompiler certainly isn't perfect, however I can use it to quickly figure out if I want to bother examining something more in-depth or skip over it.
It also seems - from my experience anyway - that Ghidra does a better job out-of-the-box at identifying and renaming functions from specific compilers/libraries, as shown below from our malware sample.
Compared to the same location in code in IDA Free:
The debugger I'm going to use is x32dbg with the OllyDump plugin installed. If the malware decodes/decrypts additional code into memory to execute, this plugin will allow me to dump the process - including memory pages with the new code - so I can import the more complete sample back into IDA/Ghidra.
The first thing I'm going to do is put some breakpoints on functions I'm interested in. To find functions I'm interested in, I'll be looking at areas of code that call LoadLibraryExW, GetProcAddress, CreateFileW, WriteFile, and VirtualAlloc. I'm choosing these because the initial static analysis indicates that this program is going to do at least one of these things, if not both:
- Decrypt/decode additional code and execute it in-memory.
- Decrypt/decode additional code to a file and execute the file.
I'm only going to start with one function: LoadLibraryExW. I'll be looking at what calls it to identify what it's loading to get a better idea of how this sample is going to work. At the very least, I'll gain some insight as to what it's trying to do. I'll expand my search if this doesn't find what I need.
(In hindsight, I should have started with VirtualAlloc - don't know why I didn't!)
It looks like all calls to it are wrapped in three different VC++ functions that each have multiple callers. Rather than set a million breakpoints, initially I'm going to set them on the actual calls to LoadLibraryExW and return up the call stack to the relevant code. I'll set more breakpoints there and restart the program if needed.
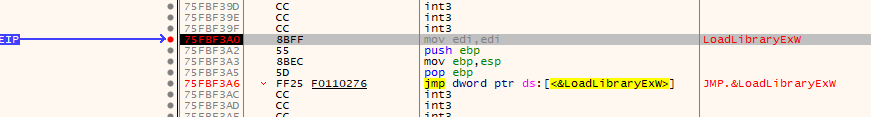
I used CTRL+G to find the library in x32dbg, set a breakpoint, and execute the program. The breakpoint hits.
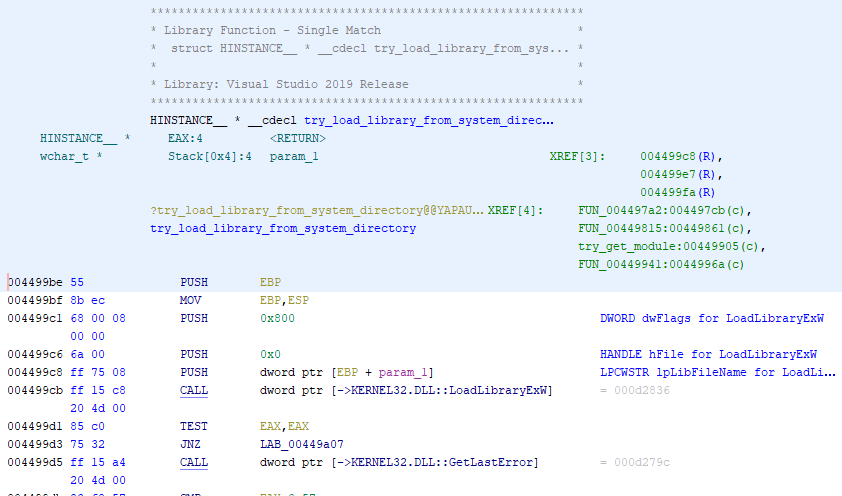
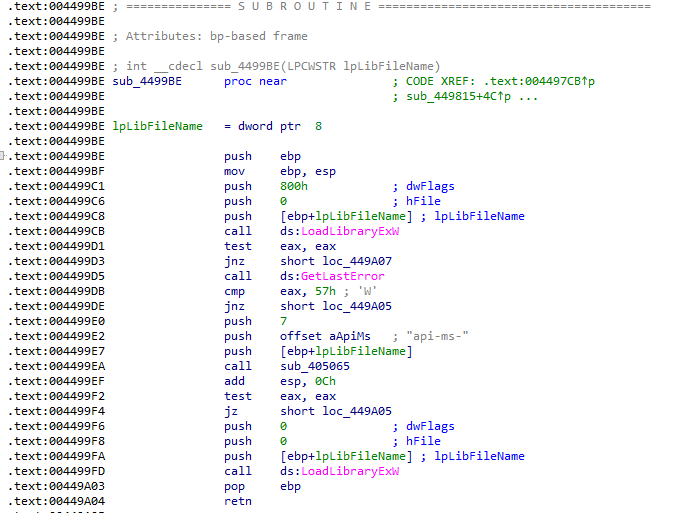
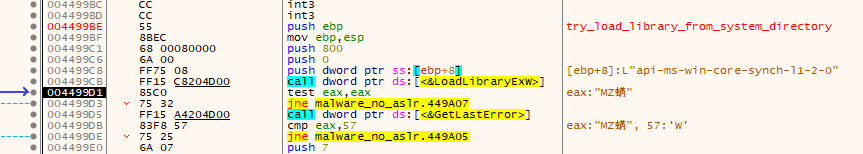
Using Execute Till Return and then a single step, I jump back to the function that called it. The first hit was from a call by the 'try_load_library...' (ID'd by Ghidra) function at address 0x004499cb. I label this function in x32dbg and IDA, then debug back up to it's caller. I check the parameters pushed onto the stack to figure out which library attempted to load, and it was "api-ms-win-core-synch-l1-2-0".
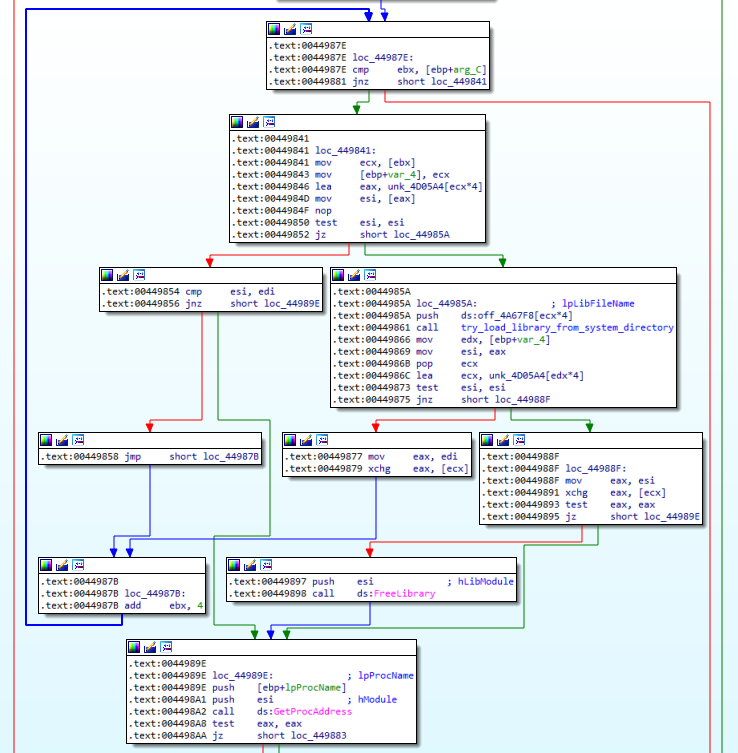
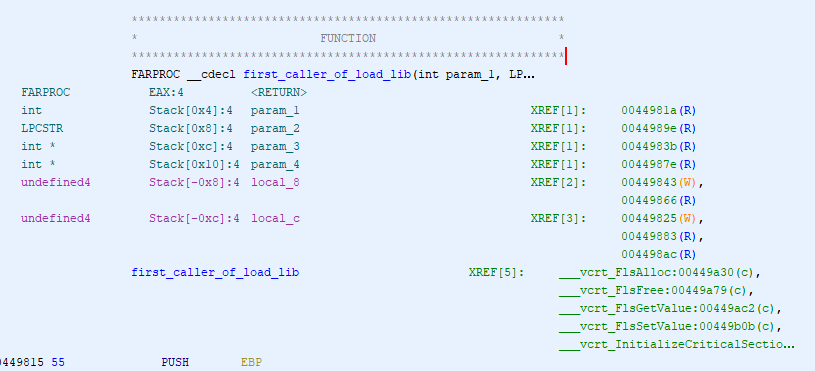
The first calling function is at 0x00449815. Looking at the code for this function in IDA Free, I can see that it's being called from a loop with the EBX register being used as the counter. If the loading fails, it will increment EBX by 4 and try again. Otherwise, it does a couple of different checks that may lead to FreeLibrary and GetProcAddress calls before the function epilogue.
Checking Ghidra, it shows that all the callers of this function are part of the VC++ startup procedures. I'm not interested in them, so anytime load library gets called by this function I'm going to keep going. I renamed the function in Ghidra, IDA, and x32dbg for easy identification.
LoadLibraryExW is called one more time from the same function for a different "api-ms-win..." library, and then the call after that is from somewhere else: 0x004792de. This function is "try_get_first_available_module", and it's caller is once again part of some startup procedures.
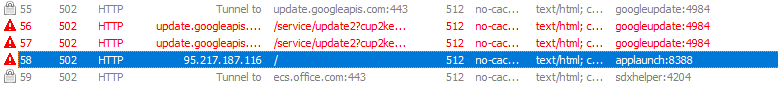
This happens a few times before I end up with an access violation... Which is interesting. Checking fiddler, there was also an attempt to connect to "95.217.187.116" - the IP address identified as an IOC by MalwareBazaar - from the application "AppLaunch".
I remember seeing a directory for AppLaunch.exe in the strings output. Probably should have paid attention to that... But now I know for the future =D
It appears tracking LoadLibraryExW isn't going to get me where I want and I need to try another function. However, before I move on to another one I want to see if I can easily find the code that starts AppLaunch by going backwards from the error. It may be intentional or a side-affect of launching the second stage.
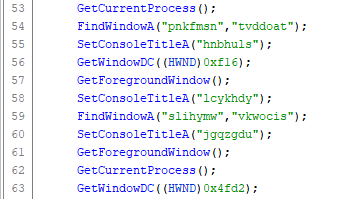
Looking at the stack at the time of the crash, I see references to some user32.dll imports. Picking one of the 4 imported functions, I find the functions that call FindWindowW in Ghidra - which is only one - and set a breakpoint at that function in x32dbg and restart the program. The entire section looks like junk code in Ghidra, with a bunch of calls with junk parameters.
I go ahead and debug into this function and start trying to find where the error occurs.
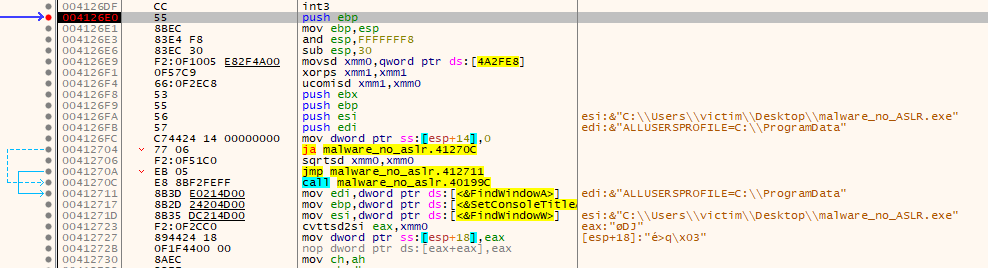
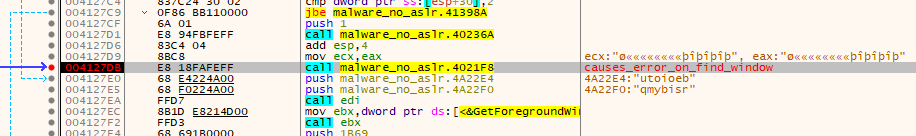
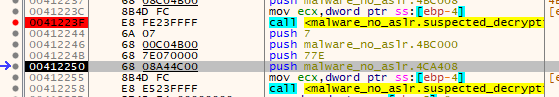
By stepping over each instruction, I'm able to locate where the exception comes from. There's a couple of unconditional calls to functions not in user32.dll shortly after a few of those junk calls to the .dll. The second one at 0x004127db (to 0x004021f8) is what throws the exception. I set a breakpoint on the function and restart the application so I can watch it execute.
Before I debug through it, I find the function in IDA Free and take a look at what it does.
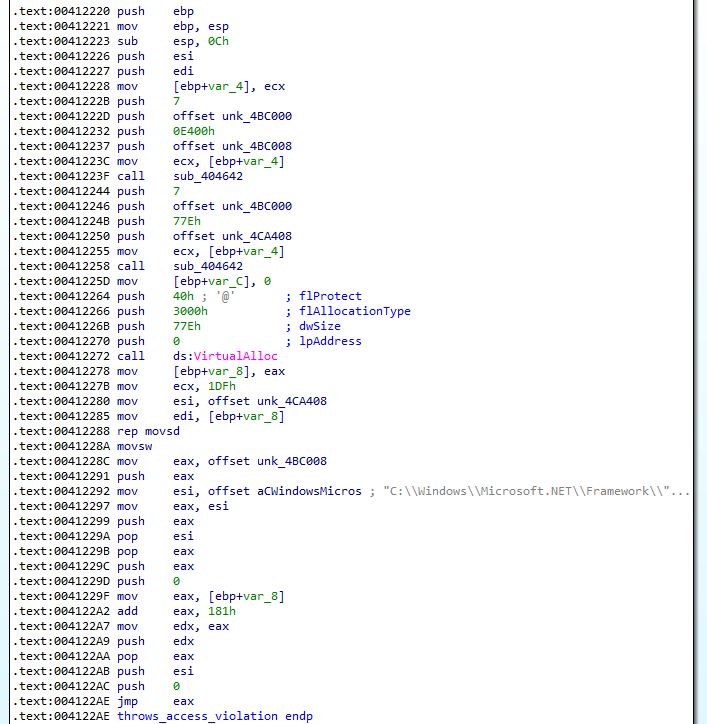
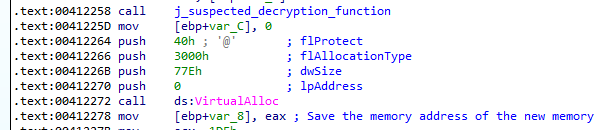
Within this function is a VirtuallAlloc call (which is another one of the functions I wanted to pay attention to) at 0x00412272. Shortly after the call, there's what looks like a segment of code to move data into the newly allocated region, and then a reference to "AppLaunch.exe" that looks like it's being used as a parameter before a JMP EAX instruction. It's also playing around with register and the stack in a way that at first glance appears to be more junk code. This definitely looks like it's launching the next stage, and it's trying to obfuscate how it's doing it.
I don't know what those two unconditional calls to an unknown function before VirtualAlloc are doing, but I suspect based on context that they may be decoding/decrypting functions. I rename them and take a look in IDA.
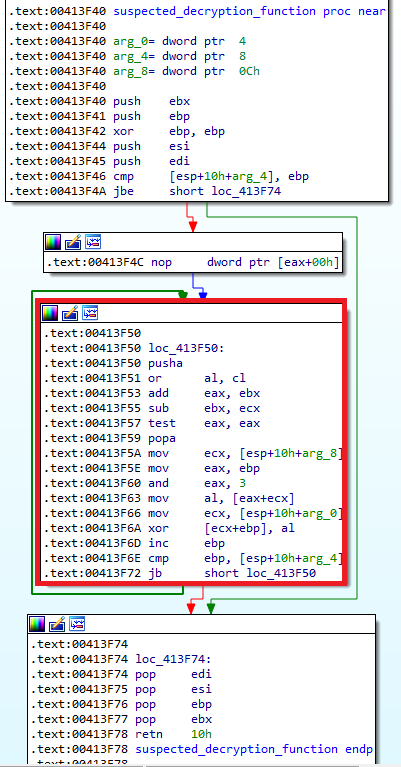
First glance shows what looks like an incremental XOR decryption function. I'm going to head to the call of this function in x32dbg to figure out exactly how it works.
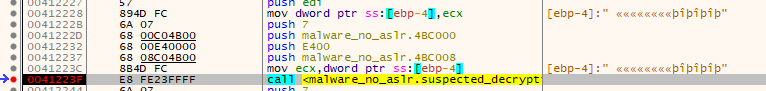
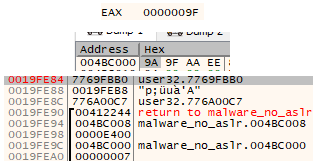
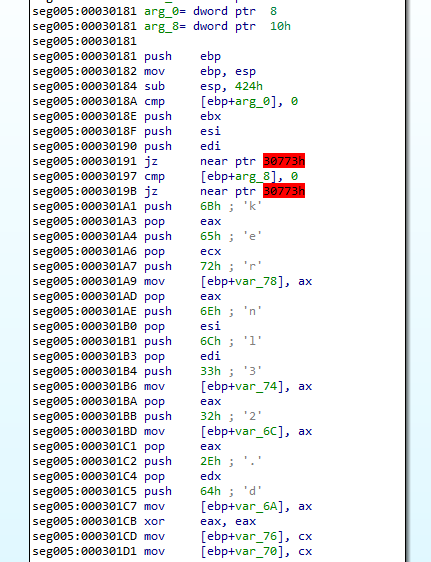
The screenshot above shows the arguments that are pushed onto the stack for the decryption function. (Note that IDA only ID's 3 parameters, but it's definitely using 4.) The number 7, Two addresses a QWORD apart - 0x4bc000 and 0x4bc008 with the value 0xe400 between them. These two addresses end up being the decryption key and decryption target with 4 bytes of space between them.
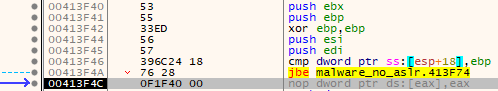
Going into the function, it pushes some items on the stack and clears out EBP... However, if you look at the actual call it jumps to a two byte offset into what IDA thinks the function start actually is - it starts at the XOR EBP, EBP instruction. After that, it compares EBP - that is now at the value of zero - with the 4th parameter passed to the function that contains the number 7.
The jump if below or equal (JBE) instruction doesn't jump since 7 is greater than zero. If the jump were taken, it would have jumped down to the function epilogue and exited.
This is rather odd as it means the 4th parameter is just a flag to exit the function immediately after it's called. Seems to just be some junk code, like the next few instructions. EBP is also the increment counter for the loop so that's why it's set to zero.
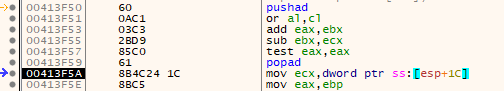
Then it stores all registers with pushad instruction. Next, the program manipulates EAX/EBX registers and the ZF flag (ZF with the test instruction) before restoring the previous register values with popad. There's no affects from any of this code on any data or the rest of the function. The EBX register isn't even used anywhere else in the function. Definitely junk code.
After this the actual work begins over the next 9 instructions.
First, it loads the address of the third parameter (0x004bc000) into ECX, then loads the loop counter into EAX before a binary AND operation against it with the value of "3". This effectively keeps the value of EAX of either 0, 1, 2, or 3 during the next instruction, starting at 0 and incrementing by one each loop until it goes past 3 and resets at 0.
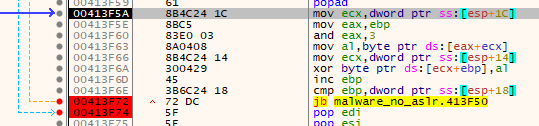
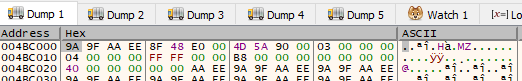
The next instruction dereferences the data at parameter 3 (0x004bc000) with the value in EAX added to it. It grabs a single byte at that location and loads it into EAX (AL). Since EAX will only ever be 0-3 every time this instruction is run, it means it will always be using 0x004bc000-0x004bc003 - a single DWORD.
The DWORD at that address in memory (with ASLR disabled of course) during runtime has the value of 0x9a9faaee and is used as the decryption key, one byte at a time, in order of 0x9a, 0x9f, 0xaa, 0xee before repeating.
The next instruction moves parameter 1 (0x004bc008) into memory, and the one after that XORs the single byte at that location with the decryption key. It's using EBP as the loop counter - so when it's used with the dereference with parameter 1, it points to the next byte in the data to decrypt.
The XOR instruction is where the decryption actually takes place on each byte.
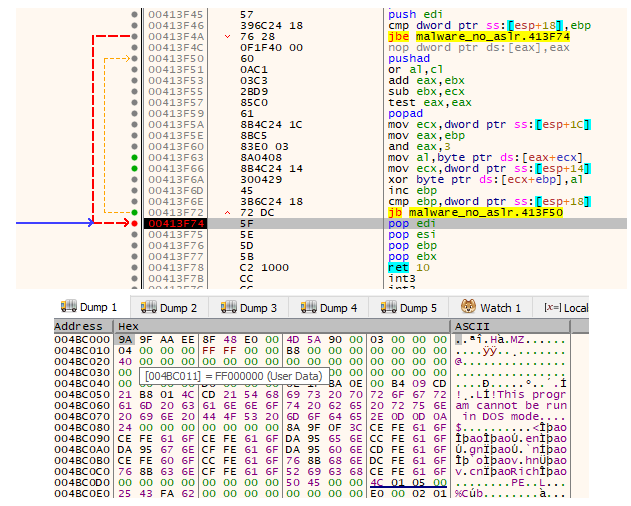
After the decryption, the loop counter (EBP) is incremented by 1 and then compared to parameter 2. If it's below the value passed in by parameter 2 (0xE400 in the first decryption function call), it continues the loop and the decryption sequence.
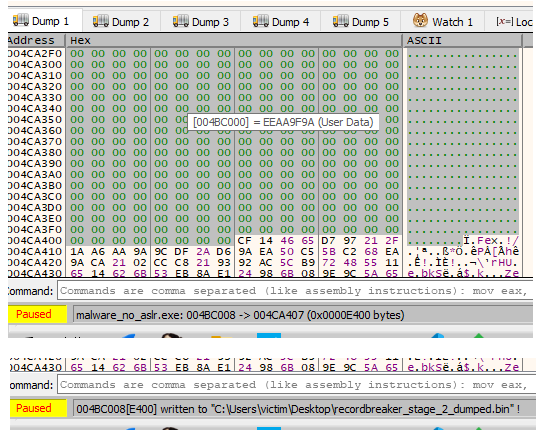
While I was incrementing trough the loop to confirm it's behavior, the first two bytes decrypted were 4D 5A - "MZ" - the magic value of a PE file. This is definitely stage two. I set a breakpoint at the end of the decryption sequence and then dump the decrypted PE file to disk. I started the dump from the "M" in "MZ" for the length of 0xe400 - same value as the decryption loop's stopping point in parameter 2. The stopping value used is of course the length of the data that was decrypted.
Awesome... but there's still an entire extra call to this decryption function, right after this one! Though now that I know how it works, I can check whatever it's decrypting much faster.
The second call's parameters looks like it's using the same key, though at a different address and length. This time it's targeting 0x004ca408 for a length of 0x77e.
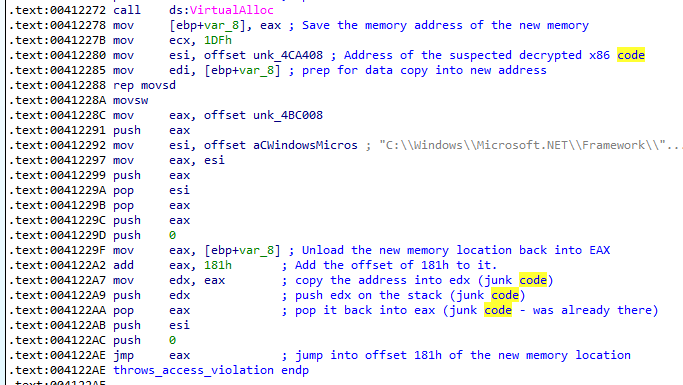
This time it doesn't have any immediately recognizable data, though I still dump it to disk to save it. I think it might be the code that gets jumped into by the function that makes these decryption calls. There's no hardcoded address for that one though, it's just JMP EAX into the address allocated by the VirtualAlloc call... Speaking of, what's the length of that again?
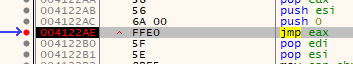
The length of the memory that is about to be allocated is 0x77e, same as our decrypted data. Taking a look at the actual code before the JMP EAX you can see that it's actually at offset 0x181 into the data. Also shown is the move of the data by movsw from our recently decrypted 0x77e bytes of suspected executable code into the 0x77e bytes of newly allocated memory. It's also littered with junk code manipulating the stack and registers.
I'm going to let execution continue into that JMP. I return from the decryption function, set a breakpoint on the JMP EAX instruction, and execute the program.
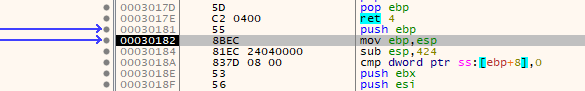
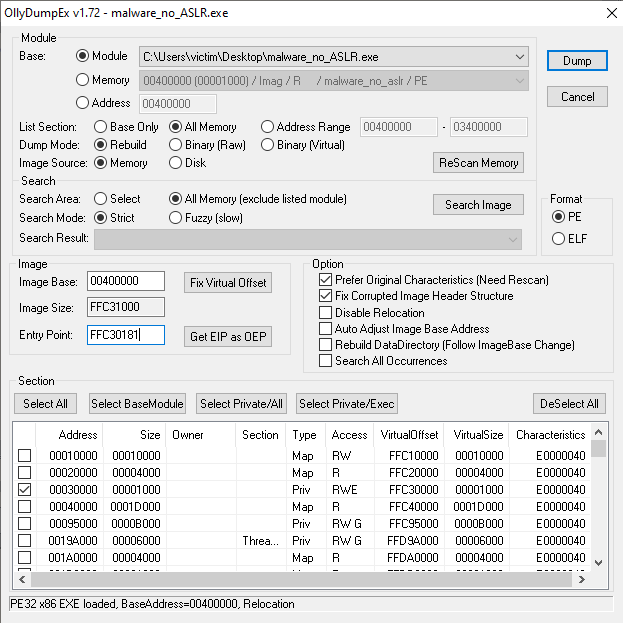
In order to be able to follow this code in IDA, I'm going to let the jump happen and then (accidently double click the step button so I'm at jump location + 1...) use the OllyDumpEx plugin to dump this new memory region, then let IDA analyze it.
I had to make sure I selected the new memory section in OllyDump, as by default it will only dump the original executable code pages. To do this, change "List Selection" to "All Memory" and then click "ReScan Memory". After you've done that, find and select the new location in memory that was allocated for the decrypted code (in this case 0x00030000) prior to dumping it.
Also, don't forget to fix the original entry point by replacing it with EIP so you don't have to go digging for the current location in IDA. The plugin will automatically do the calculations to fix it when you press the "Get EIP as OEP" button. You don't have to worry about the other decrypted payload as that memory region resides within the original PE, OllyDumpEx has already selected it. You might get errors about the image base size being incorrect - that's fine. IDA will work with it without a problem.
(Also note that I changed mine from x30182 to x30181 because I accidentally double clicked the step button a bit ago...)
End of Part 1
To summarize, I've extracted a decrypted PE file that I believe to be stage two. That stage two will probably be launched with the .Net AppLauncher within the newly decrypted code residing in the new memory page.
Lessons Learned:
- AppLauncher in a string is something to pay attention to.
- Just go straight for VirtualAlloc next time.
Analysis of stage two will be posted as part two, hopefully within a week. I'll update this page with a link to part 2 right here when it's up.
Now I have to go find a funny picture of a Raccoon...
Link to part 2 (12 minutes).