RecordBreaker Malware Analysis, Part 2
RecordBreaker malware (AKA Raccoon Stealer V2) is reported to be a "full rewrite in C/C++" of Raccoon Stealer. The Racoon Stealer malware family is an MaaS (Malware as a Service) "product" available for sale in online black markets that is primarily reported to be a password/credential stealer.

This is part two of this writeup.
In this part, I'm going to work with the newly decrypted loader code that launches the (also newly decrypted) stage 2 executable found in part 1. This part of the analysis is done without the help of Ghidra - I'm prepping for my OSED exam and Ghidra is banned for it.
Decrypted Loader Code Analysis
Checking For String Changes
The first thing I'm going to do is check to see if there's any new strings in the primary executable or the dumped stage 2 after the two different sections were decrypted that can reveal anything. I did this by throwing them back into PEStudio to let it run all of it's regex and tagging against it rather than sort through it manually. The interesting stuff all comes from the dumped stage 2.
The results that I find interesting are mostly new libraries names and some file names/extensions:
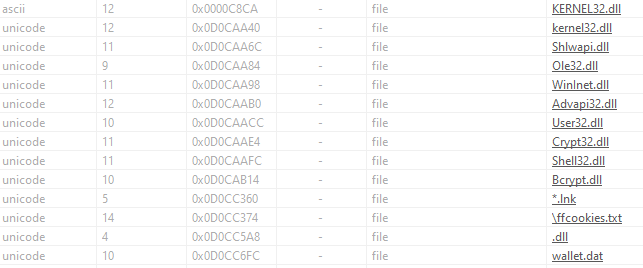
We also have encryption and connection functions loaded (as you can expect from the imports shown above - Crypt32.dll, Bcrypt.dll, WinInet.dll).

Nothing is immediately useful since I have to analyze the decrypted loader code before analyzing the actual stage 2. I need to know how stage 2 executed to ensure I'm observing the true behavior - there are various ways it could detect that it wasn't executed by the loader.
Locating Libraries & Functions In Memory - Shellcode Style
I already have a pretty good idea of how stage one's decrypted code is going to execute stage 2. In some way, it's going to use/hijack the "AppLaunch" executable from Microsoft's .net package to execute the second stage. However, I want to figure out exactly how it's doing it so I can gather IOCs for the sample/malware family as well as the exact tactics it uses.
Note that IDA is having issues figuring out the jumps to create a jump graph. I know the cause of the issues have something to do with the way I dumped the running stage 1, but don't know how to resolve the issue. If you do, please let me know what I did wrong. :D
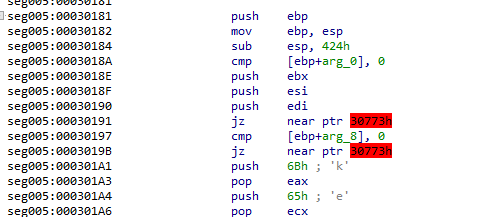
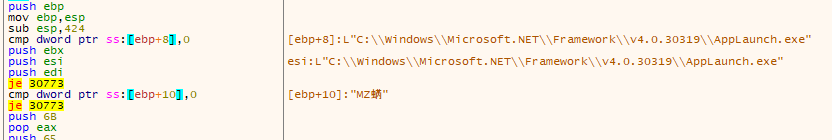
These jumps are jumping into an area of memory that, while allocated and part of the heap with the execution flag set (they are in the same memory page), contains nothing but null bytes.
However looking at the actual comparisons at run time, you can see that the stack data they comparing are definitely not equal to zero. They're the path to the AppLaunch.exe file and a pointer to the MZ header of the suspected stage 2 executable. Since they're JE (jump if equal) conditional jumps, they will just be skipped.
This could possibly be some kind of anti-analysis technique in case an analyst tries to run or analyze this code separately from the original process where the stack data wouldn't be present. On the other hand, it could just be junk code. They could also be checking that previous code for stage 1 executed successfully. No matter the answer, I'm moving on.
The next set of instructions appear to be loading the strings "kernel32.dll" and "ntdll.dll" into a location on the stack, but hiding the strings by using individual push, pop, and mov instructions out of order. It also doesn't have any repeat characters used, rather it just moves the same one into multiple locations. This is another anti-analysis technique.
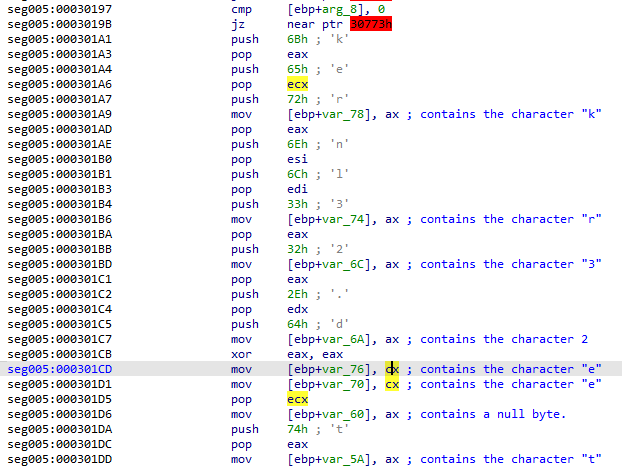
A tip on analyzing this manually in IDA - click the register next to the MOV instruction and IDA will highlight all the uses of it. Find the most recent push/pop for each MOV call to easily ID what the register has in it at that time. You can also just jump to the end of these statements and check the changes on the stack, but that's less fun. :D
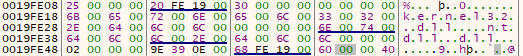
The screenshot below shows the strings in the location on the stack right before the call instruction at 0x00030223. Note that they're 16-bit (word) chars and are terminated by null words - confirming that they are intended to be used as separate strings and are likely 16-bit Unicode strings.
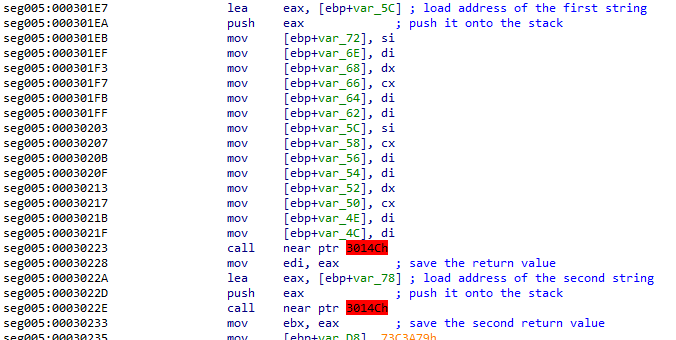
Moving on to the call instructions, it seems to call the same function twice - once for each string. It's passing the location to each string to the function call via the stack using LEA and PUSH instructions. Note that the first address is pushed onto the stack before it actually finishes the string building.
I suspect this function is going to find the address(es) of these modules within the program's memory so it can then find and call functions within them. It's a common technique used for shellcode. It attempts to find where a library was placed in memory by ASLR. I learned how to employ this technique while learning to write shellcode in the WUMED course from OffSec, and the context adds up.
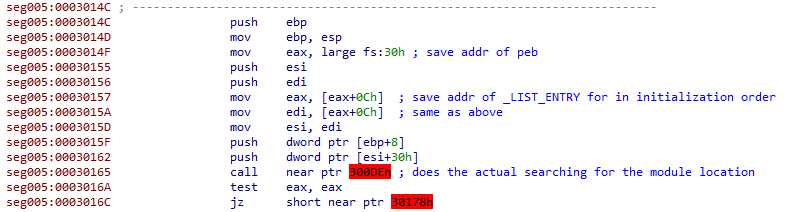
IDA doesn't like these addresses either, however they do actually contain code unlike the jumps from earlier. It's a short function that locates the base module address for a library that's already been loaded into memory.
Explaining exactly how it works would take an entire blog post of it's own and is outside the scope of this writeup. For a detailed explanation, see this article from Red Team Experiments / ired.team.
In a quick explanation, it's using a pointer found within the PEB to locate a list of modules that have already been loaded by the application. It walks this linked list to locate the base address for the module it's looking for - in our case "kernel32.dll" and "ntdll.dll". Once found it returns the module's base address. Later on, the program will use data within the PE headers of these already loaded modules to locate similar lists for each module's exported functions.
At the end of this series I may come back to this with an appendix post detailing exactly how it works. For now, I'm going to jump over the call instructions.
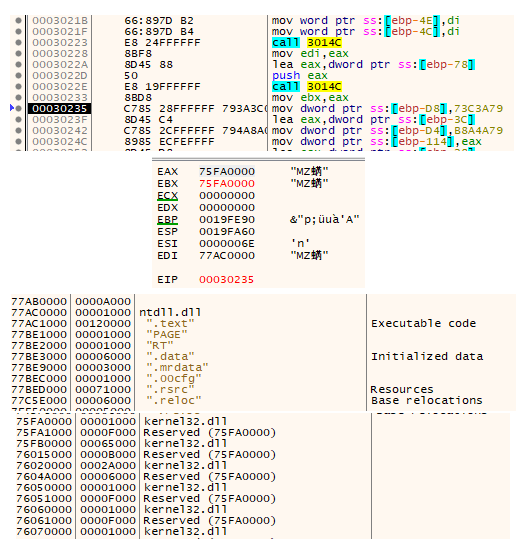
As you can see in the above screenshots, the function successfully located the addresses of the modules at 0x75FA0000 for "kernel32.dll" and 0x77AC0000 for "ntdll.dll".
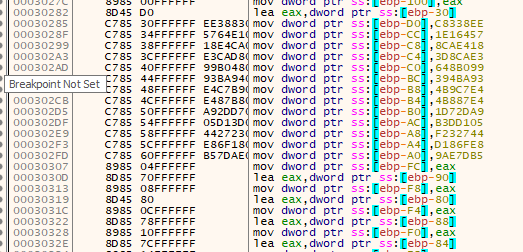
Next, it loads a bunch of hard-coded data values onto the stack as well as moves around data within the stack. These might be DWORD-sized hashes or ordinal numbers for functions it is going to find using the next function call. I suspect they're DWORD sized function hashes.

As before, the exact explanation is too extensive for the size of blog post I'm targeting. The same link to ired.team can also explain this in detail if you are inclined to learn about it.
Quick explanation: The shellcode is going to do a very similar thing as before with the module addresses, but this time it is going to search for function addresses using hash values of their names.
I'm not going to take the time to examine these functions myself since based on context I already know what it's going to do even if I don't know the exact method(s) it will employ. If you try to reverse engineer every single thing in a piece of malware, you'd spend weeks with each sample. In a SOC or similar environment you often won't have time for that. When you see a pattern of behavior that you recognize, you jump to the important parts within it or jump over it. Sometimes malware authors take advantage of this fact... so be warned.
You can always take a snapshot and revert back to it if you end up needing to take a closer look after all. I've identified basic shellcode behavior, so I'm going to skip over this function call to try and save some time with this analysis. There is a small risk I'll miss something, but with a standard MaaS application I'll take that risk.
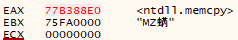
First thing to note after the call is that the return value seems to be the address of the memcpy function from "ntdll.dll". It then stores the address at an address on the stack.
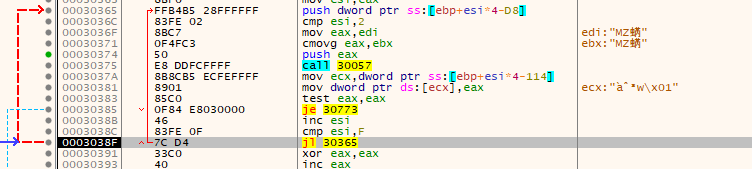
After than it checks to make sure EAX wasn't set to the value of zero - if it was, it would have jumped into the null bytes at the end of the shell code. This is a check to make sure the function address was successfully found.
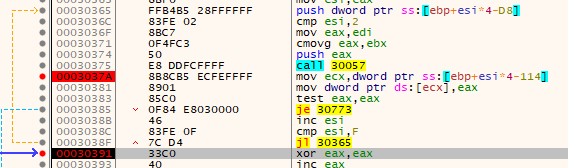
It also compares the value of ESI to 0x0F and jumps if it's lower - which it is in this case as ESI was set to 0x01. This jump forms a loop that continues to locate the various functions it needs - and 0x0F is the stopping point.
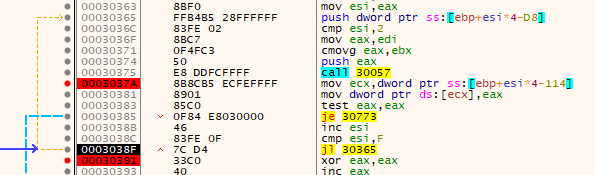
Setting 3 breakpoints - one at loop end, one after each function address resolution function call, and one at 0x030773 (not shown) - I let the program continue. Each time it finds a new address, I take note of the function. I will do this until it hits either the end of the loop or the null bytes get jumped into.
The complete list of functions that it resolved addresses for:
- ntdll.memcpy
- ntdll.RtlZeroMemory
- ntdll.ZwUnmapViewOfSection
- kernel32.CreateProcessW
- kernel32.VirtualAllocEx
- kernel32.VirtualAlloc
- kernel32.WriteProcessMemory
- kernel32.TerminateProcess
- kernel32.GetThreadContext
- kernel32.SetThreadContext
- kernel32.ReadProcessMemory
- kernel32.VirtualFree
- kernel32.ResumeThread
- kernel32.VirtualProtectEx
- kernel32.CloseHandle
"What a lovely group of functions, nothing malicious can be done with them!" typed the blog author, sarcastically.
Fortunately I hit my breakpoint at the end of the loop, meaning there weren't any errors or unresolved function addresses.
Executing The Launch Procedures
After the loop it prepares for a call to a memory address on the stack that contains the value of 0x77B48140 - ntdll.RtlZeroMemory. It passed two parameters for the call: A stack location and the value 0f 0x10.
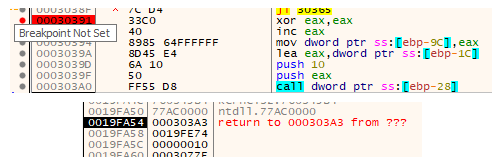
Looking at the prototype for RtlZeroMemory below, it's clear that it was zeroing out 0x10 bytes of data at the stack location passed into it. It was zeroing out four DWORD at 0x0019FE74.
void RtlZeroMemory(
   void*  Destination,
   size_t Length
);
It does this two more times for other addresses on the stack with different lengths, for a total picture of:
- 0x10 bytes @ 0x0019FE74
- 0x44 bytes @ 0x0019FD38
- 0x2cc bytes @ 0x0019FA6C
Note that the 0x19FA6C + 0x2cc is 0x19FD38 - so the second two would have been a continuous zone of null bytes after these operations if it also didn't push the value of 0x44 right to 0x0019FD38 right before the last call to RtlZeroMemory.
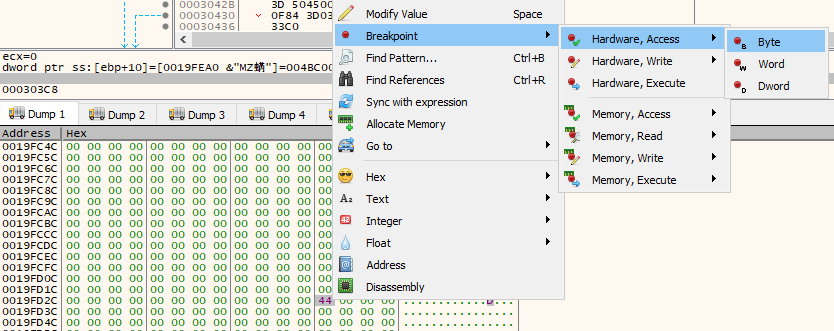
I don't know what it's doing with these memory sections, so I'm going to set a hardware breakpoint for access on each of these address for a length of 1 byte. This way I won't miss anything done to them (assuming it starts at the first byte) if I end up jumping through some code I want to skip during my dynamic analysis debugging process.
Note that x32dbg doesn't support memory breakpoints for access on exact addresses, only entire blocks. If the blocks were in the heap this might work just fine, however since these addresses are on the stack that's not particularly useful. It would be constantly hit - so I have to use some of my limited-in-number hardware breakpoints instead.
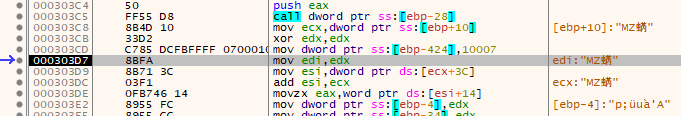
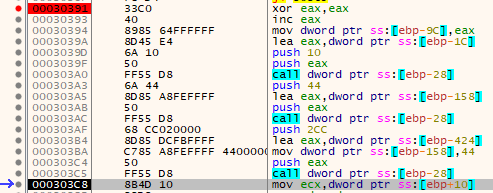
The next thing the application does is load the address of the decrypted executable (suspected stage 2) into the ECX register. After this it moves the value of 0x10007 into the beginning of the larger memory region it just zero'd out. Note this also triggered the hardware breakpoint, though since I was already debugging I didn't need it to hit.

Next it uses EDX (null) to zero out several locations on the stack prior to comparing a location within the suspected stage 2 executable with the value of zero for a short jump that skips some other checks that bypass a jump. There's a few of these checks, each one is checking zero or one against locations within the decrypted executable in memory. None of them hit and the jump is taken which bypasses the zeroing out of a location on the stack that contains the value 0x1.
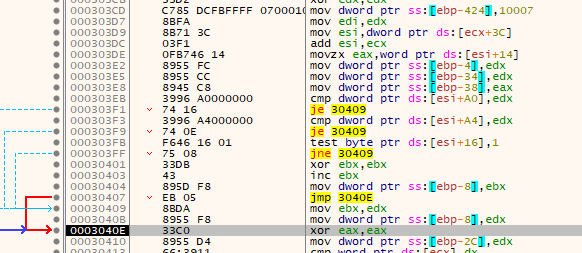
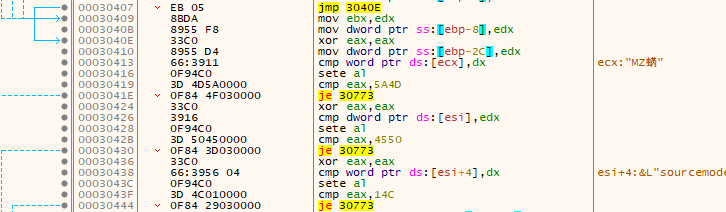
Next it overwrites another point on the stack. It continues to do some more checks that I think are just junk as they will never succeed - things like zeroing out EAX and then comparing it to a hard-coded non-zero value. The jump will never be taken. The jumps are, as before with some previous junk code, all to the end of this decrypted code that contains nothing but null bytes.
After these junk calls, it pushes some data onto the stack in preparation for a function call to CreateProcessW.
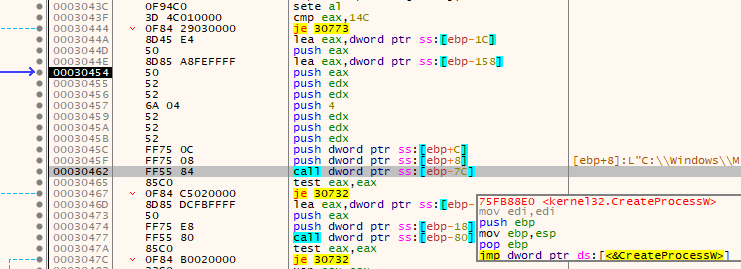
To figure out exactly what these arguments are, I'm once again going to reference the function prototype and the Microsoft docs.
BOOL CreateProcessW(
  [in, optional]      LPCWSTR               lpApplicationName,
  [in, out, optional] LPWSTR                lpCommandLine,
  [in, optional]      LPSECURITY_ATTRIBUTES lpProcessAttributes,
  [in, optional]      LPSECURITY_ATTRIBUTES lpThreadAttributes,
  [in]                BOOL                  bInheritHandles,
  [in]                DWORD                 dwCreationFlags,
  [in, optional]      LPVOID                lpEnvironment,
  [in, optional]      LPCWSTR               lpCurrentDirectory,
  [in]                LPSTARTUPINFOW        lpStartupInfo,
  [out]               LPPROCESS_INFORMATION lpProcessInformation
);
Going through the parameters, the following values are not/will not be interpreted as null:
| Parameter | Value |
|---|---|
| lpApplicationName | The directory for the .net AppLaunch executable |
| bInheritHandles | False (zero/null) |
| dwCreationFlags | 4 |
| lpStartupInfo | Pointer to 0x0019FD38 (0x44 and the rest null); previously zero'd memory. |
| lpProcessInformation | Pointer to 0x0019FE74 (null); previously zero'd memory. |
The CreationFlag being 4 starts the process in a suspended state. The structure at 0x0019FE74 will become a PROCESS_INFORMATION structure after the call is complete. This structure is also 0x10 bytes long, corresponding to the 0x10 length RtlZeroMemory call made previously. It contains some useful information if you want to modify a suspended process you just created.
typedef struct _PROCESS_INFORMATION {
  HANDLE hProcess;
  HANDLE hThread;
  DWORD  dwProcessId;
  DWORD  dwThreadId;
} PROCESS_INFORMATION, *PPROCESS_INFORMATION, *LPPROCESS_INFORMATION;
To prevent a breakpoint from hitting during the CreateProcessW call, I'm going to disable my hardware breakpoint for this address as well as the mostly-null STARTUPINFO struct for lpStartupInfo. The 0x44 is there as the first-byte value because it's the "cb" DWORD in little endian. If you recall back to when that region was zeroed out, it was also zeroed to a length of 0x44.
cb
The size of the structure, in bytes.
The way those two areas are used causes me to expect that whatever 0x0019FA6C ends up being used for, it's some kind of struct that is 0x2cc bytes long needed for one of the function calls I'm about to cover.
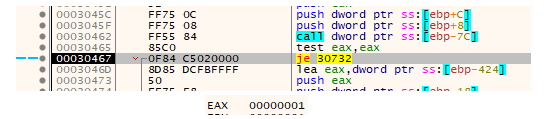
Stepping over the call and letting it execute, it returns a value of 1 indicating success. The malware then checks this return result and skips a jump that would have terminated the stage one malware process.
End of Part 2
In this part, we saw some common shellcode tactics to dynamically locate previously loaded libraries without having to call Windows APIs. After that there was some prep for and a call to CreateProcessW to start the .net AppLaunch process in a suspended state.
As for what's next in part three, well... What would you do with a newly created suspended process, a decrypted PE in memory, and the addresses to functions like WriteProcessMemory/ZwUnmapViewOfSection stored on your stack? Thinking about it might leave you feeling a little empty...