RecordBreaker Malware Analysis, Part 3
If you remember from part 2 of the writeup series, we left off with an instance of AppLaunch.exe created in a suspended state. I left some hints at what it was going to be used for. If you didn't pick up on it - spoiler alert - it's process hollowing. In this part, I'm going to work with...

This is part three of this writeup, links for previous parts: Part 1; Part 2;
If you remember from part 2 of the writeup series, we left off with an instance of AppLaunch.exe created in a suspended state. I forgot to mention it in the last post, but AppLaunch.exe is a valid Microsoft-signed executable and it wasn't installed or dropped by the malware. I left some hints at what it was going to be used for:
What would you do with a newly created suspended process, a decrypted PE in memory, and the addresses to functions like WriteProcessMemory/ZwUnmapViewOfSection stored on your stack? Thinking about it might leave you feeling a little empty...
If you didn't pick up on it - spoiler alert - it's process hollowing. In this part, I'm going to work with a portion of the shellcode that conducts the process hollowing (except the newly created suspended process covered in part 2).
I'm going to start with a quick review of the programs current state, then move into the basics of process injection/hollowing, and finally cover the actual analysis of the process hollowing code from the malware sample. This one might be a little hard to follow, so the actual analysis is broken up into sections by groups of function calls. At the end of each section there's a quick "Why this/these calls:" paragraph that attempts to summarize it.
Quick Review of Program State
If you didn't read part 2 or it's been too long for you to remember exactly what was going on where we left off - this section is for you.
Currently, we're debugging some code that the primary application decrypted and stored in a heap location before transferring execution into it at an offset of 0x181 bytes. This piece of decrypted code is shellcode. In addition to that, at address 0x004BC008 the program decrypted an executable that is almost certainly going to be the second stage of the malware that will be executed by the shellcode.
As stated in the intro, we left off with this shellcode where the process AppLaunch.exe had just been created in a suspended state. The shellcode first found the locations of ntdll and kernel32 in memory before locating various functions within them (listed below). We also discovered what two of the blocks of zeroed out memory on the stack were for: a STARTUPINFO struct @ 0x0019FE74 and a _PROCESS_INFORMATION struct @ 0x0019FD38. There's also another yet-unidentified structure @ 0x0019FA6C.
The following functions are the ones that had their addresses stored on the stack after they were found by the shellcode:
- ntdll.memcpy
- ntdll.RtlZeroMemory
- ntdll.ZwUnmapViewOfSection
- kernel32.CreateProcessW
- kernel32.VirtualAllocEx
- kernel32.VirtualAlloc
- kernel32.WriteProcessMemory
- kernel32.TerminateProcess
- kernel32.GetThreadContext
- kernel32.SetThreadContext
- kernel32.ReadProcessMemory
- kernel32.VirtualFree
- kernel32.ResumeThread
- kernel32.VirtualProtectEx
- kernel32.CloseHandle
We've already seen the use of a couple of them, but most haven't been used yet.
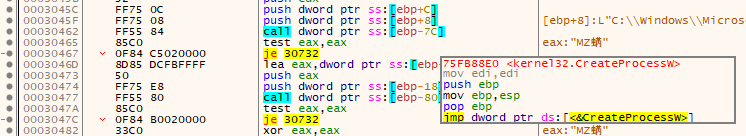
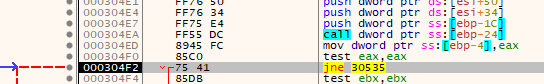
Note: If you're following along and trying to figure out what each call is, just hover your cursor over the EBP-## and x32dbg will give you a preview of the dereferenced location, like this:
Quick Overview of Process Hollowing
Process Injection
If you're unfamiliar, process injection is common technique employed by malware authors as it allows their code to execute within another process - the "target process". Any malicious activity would show up as having been conducted by the target process. It can also be used by malware authors to prevent/delay incident responders and SOC analysts from finding their true decrypted or deobfuscated payload or even noticing an infection in the first place.
As you've seen (or would have if you'd read it) in part 1 of the RecordBreaker sample analysis series - after the shellcode conducts the process injection via process hollowing the program terminates itself with an access violation exception. This means that the only copies of the stage two code on the system after it executes are going to be 1) The encrypted copy in the data of the original RecordBreaker sample and 2) Within the memory of the target application - AppLaunch.exe.
This means that a SOC or Incident Response analyst would have to recognize that the target application has some unusual characteristics - whether behavioral, meta-data based, and/or knowing their systems well enough to know what isn't normal (as SANS often puts it - you have to know normal to know evil). After they've done that, they would have to dump the memory of the target process to recover the second stage.
Process Hollowing
Process hollowing is a variation on process injection that begins with a brand new instance of a process being created in a suspended state (sound familiar yet?). After it's created, its memory is unmapped, reallocated, and then filled with the malicious code - this is where the "injection" occurs. In our case it will be injecting the decrypted executable from address 0x004BC008.
Along with fixing up the permissions to make the memory region(s) executable, it will need to overwrite the value of the EAX*** register with the entry point of the malicious code. Finally, it is resumed - executing the malicious code that was injected into it.
***The EAX register holds a programs entry point prior to execution after the operating system has completed its prep procedures. Since the process was created in a suspended state, EAX is still holding the entry point. If overwritten before the program is resumed, you can change the entry point of the application.
For a detailed explanation with instructions, code examples, and useful diagrams see this white paper (pdf) by John Leitch. An even more detailed explanation of the process can be found in this article from Aon Cyber Labs.
Actual Continuation of Analysis
All that boring memory and code stuff is over, right?
...right?
GetThreadContext
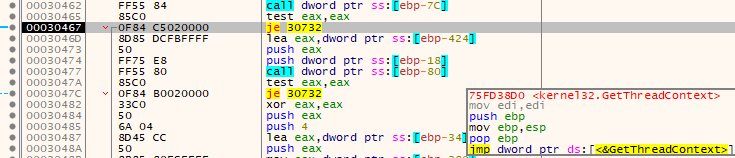
Starting off where we left off after the new process was created in a suspended state, the next call is to kernel32.GetThreadContext.
Function prototype and actual values passed:
BOOL GetThreadContext(
  [in]      HANDLE    hThread,
  [in, out] LPCONTEXT lpContext
);| Parameter | Value |
|---|---|
| hThread | 0x120 |
| lpContext | Address of 0x0019FA6C - perviously zero'd memory. |
The value 0x120 is the thread handle - gathered from the STARTUPINFO struct @ 0x0019FE74. As a reminder, this struct was used with the kernel32.CreateProcessW call in part two that launched the AppLaunch.exe target process in a suspended state. The call to CreateProcessW placed a handle to the new application and it's primary thread into this struct.
The previously unidentified structure @ 0x0019FA6C will be initialized by the GetThreadContext function. It will contain information about the thread after the function call successfully completes. From the docs linked above:
A pointer to a CONTEXT structure (such as ARM64_NT_CONTEXT) that receives the appropriate context of the specified thread.
Why this call: This call is being made to acquire this CONTEXT structure - there's information within it that is required for process hollowing. It will also be used with a paired kernel32.SetThreadContext call to adjust the target process's EAX register later on.
ReadProcessMemory
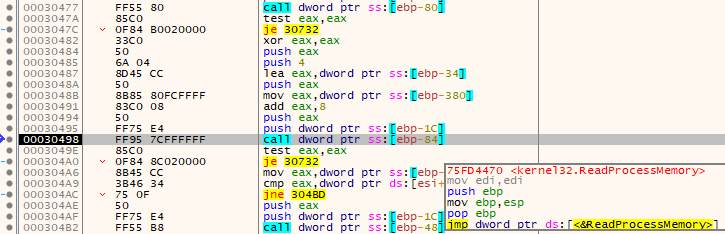
After once again checking to make sure the call executed correctly, it begins prep for and calls kernel32.ReadProcessMemory.
Function prototype, final values, and quick explanations:
BOOL ReadProcessMemory(
  [in]  HANDLE  hProcess,
  [in]  LPCVOID lpBaseAddress,
  [out] LPVOID  lpBuffer,
  [in]  SIZE_T  nSize,
  [out] SIZE_T  *lpNumberOfBytesRead
);
Chart for values:
| Parameter | Value |
|---|---|
| hProcess | 0x124 |
| lpBaseAddress | Address of 0x04C46008 |
| lpBuffer | Address of 0x0019FE5C |
| nSize | 0x04 |
| lpNumberOfBytesRead | NULL pointer - parameter ignored by function |
Easy ones up first, hProcess is the handle to the process the function call is targeting. This is obtained from the STARTUPINFO struct @ 0x0019FE74 just as before with the thread handle in the kernel32.GetThreadContext call covered above.
The lpBuffer parameter is the buffer within the local memory to write the bytes retrieved from the remote process to, and the nSize value of 0x04 will read 4 bytes. Null pointer lpNumberOfBytesRead would - if used - be a pointer to an unsigned integer that ReadProcessMemory would write the total number of bytes read into.
The one I skipped, lpBaseAddress is a bit more complicated to explain. It resides within the LPCONTEXT structure used in the previous call:

Note the lpBaseAddress value isn't actually allocated within this process. That's because it is in the remote process - the one that the hProcess handle represents. From what I can tell from the Microsoft docs on CONTEXT structures - that address should contain the stack base pointer (EBP) value of the new process. This is based on the distance from the start of the structure and the declared members within it (too long to list here)... however there's a problem.
The only documentation I can find seems to represent a 64bit CONTEXT structure while both the malware and target process of AppLaunch.exe are 32-bit. It is certainly not going to add-up to a 32 bit CONTEXT structure. Additionally, the writeup or whitepapers I listed above in the process hollowing explanation seem to agree that at this stage it should be looking for the target process's base address and not the stack frame's base address.
Taking a look at the memory (of AppLaunch.exe) in Process Hacker, we can see that the address actually falls within the PEB of the target process:
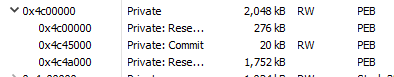

Even though I can't find proper documentation on the type of CONTEXT structure in use, I can still determine that the address being read is at PEB + 0x8 of the target process. What is at PEB + 0x8? Why, it's none other than the image base address of course!
typedef struct _PEB {
  BOOLEAN                 InheritedAddressSpace; // 1 byte  (1)
  BOOLEAN                 ReadImageFileExecOptions; // 1 byte  (2)
  BOOLEAN                 BeingDebugged; // 1 byte  (3)
  BOOLEAN                 Spare; // 1 byte  (4)
  HANDLE                  Mutant; // 4 bytes (8)
  PVOID                   ImageBaseAddress;	// 4 bytes
  [...]
Struct information is from undocumented.ninternals.net, not Microsoft. Comments on size added for clarity.
The shellcode needs this address to overwrite the space with the second stage code in order to complete the process hollowing.
So now we can confirm that this ReadProcessMemory call is attempting to locate the pointer to the module's base address within the PEB. Letting the function call execute, after the return we can see that the 4 byte buffer @ 0x19FE5C now contains the value of 0x00800000 - which matches up with process hacker's.
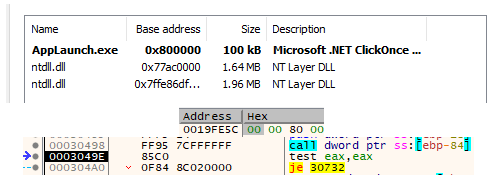
Why this call: This call is finding the base address of the AppLaunch.exe executable. It is required for process hollowing - the shellcode needs the base memory address of the target executable's original image.
VirtualAllocEx & VirtualAlloc
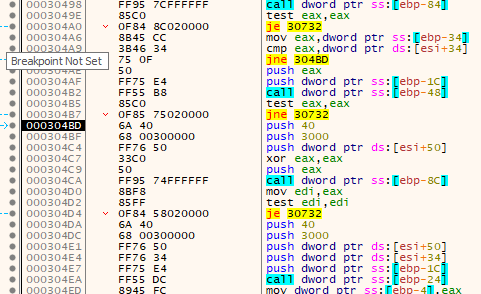
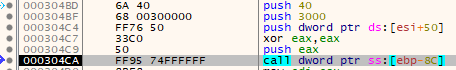
First, it checks to see if the ReadProcessMemory call was successful. Next, it checks to see if the base address matches the value 0x00400000 from within the decrypted executable's header - which it doesn't. If they had matched, it would have unmapped 1024 bytes of memory at the suspended process's base address.
Since they don't hold the same value, it skips that ntdll.ZwUnmapViewOfSection call and jumps down to the prep for a couple of calls to kernel32.VirtualAlloc and kernel32.VirtualAllocEx.
The two memory allocation functions are different in functionality. Any Windows API function with the "Ex" extension on the end of it's name is an Extended function. The "Ex" functions are updated version that contain changes that breaks compatibility with their original counterparts. The originals were left in place to provide backwards compatibility, and the new version had the "Ex" appended to them.
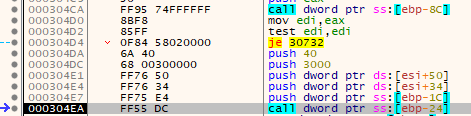
Starting with the first call which is to the original kernel32.VirtualAlloc:
Function prototype:
LPVOID VirtualAlloc(
  [in, optional] LPVOID lpAddress,
  [in]           SIZE_T dwSize,
  [in]           DWORD  flAllocationType,
  [in]           DWORD  flProtect
);
Values passed for this specific call:
| Parameter | Value |
|---|---|
| lpAddress | NULL |
| dwSize | 0x12000 |
| flAllocationType | 0x3000 |
| flProtect | 0x40 |
The first parameter - lpAddress - being null means that the program wants Windows to determine where to place the region on the heap. The dwSize parameter should be self explanatory. Next is the protection flag - flProtect - which sets the protection level of the memory region. The value of 0x40 represents the flag PAGE_EXECUTE_READWRITE.
Parameter flAllocationType is a combination of two flags: MEM_COMMIT that will ensure the space is zeroed out and MEM_RESERVE which reserves the space in the process's virtual memory without allocating it within physical memory/page file. Reference is the function doc link above for kenel32.VirtualAlloc.
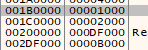
Kernel32.VirtualAlloc will return the address of the newly allocated space within the EAX register - in this case it is @ 0x001D0000. After the function returns, the shell code saves the address in the EDI register prior to checking to make sure it isn't null/zero - which would indicate an error.
It passes the test and the program moves on to the next call - kernel32.VirtualAllocEx.
Function prototype:
LPVOID VirtualAllocEx(
  [in]           HANDLE hProcess,
  [in, optional] LPVOID lpAddress,
  [in]           SIZE_T dwSize,
  [in]           DWORD  flAllocationType,
  [in]           DWORD  flProtect
);
The function kernel32.VirtualAllocEx has one additional parameter that kernel32.VirtualAlloc does not: hProcess - a handle to a process.
Values passed for this specific call:
| Parameter | Value |
|---|---|
| hProcess | 0x124 (AppLaunch.exe) |
| lpAddress | 0x00400000 |
| dwSize | 0x12000 |
| flAllocationType | 0x3000 |
| flProtect | 0x40 |
This time it's using the same size, allocation type, and protection flags. However it's targeting the address @0x00400000 within the AppLaunch.exe. It is once again using the handle from the STARTUPINFO struct @ 0x0019FE74 that was populated with the handles by kernel32.CreateProcessW.
This value of 0x00400000 may explain why it skipped the ntdll.ZwUnmapViewOfSection call from earlier. It was coded to only unmap the memory of the original AppLaunch.exe code if the base address of the target process was the same as where it is hard-coded to write the stage 2 code - that address being @ 0x0040000.
Why the kernel32.VirtualAlloc call: This allocated some heap space in the current process for a yet-unknown reason. TODO: find reason.
Why the kernel32.VirtualAllocEx call: This call allocated space within the target process (AppLaunch.exe) to copy the stage 2 code into.
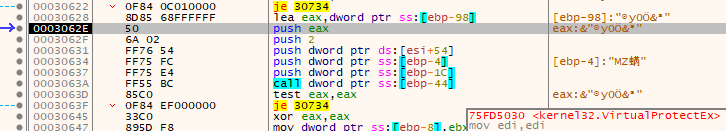
MemCpy (Multiple)
After the kernel32.VirtualAllocEx call saves the return value (which is the base address of the allocation memory region - 0x00400000) and hits a jump that skips ntdll.ZwUnmapViewOfSection and VirtuallAllocEx call group. The jump is a conditional JNZ/JNE . This is checking to make sure the function returned successfully.
The next call after this jump executes is to ntdll.memcpy.
The function prototype:
void *memcpy(
   void *dest,
   const void *src,
   size_t count
);
The values passed for this specific call:
| Parameter | Value |
|---|---|
| dest | 0x001D0000 - Address of the data allocated by the kernel32.VirtualAlloc call covered previously. |
| src | 0x004BC008 - Address of the decrypted stage 2 executable. |
| count | 0x400 |
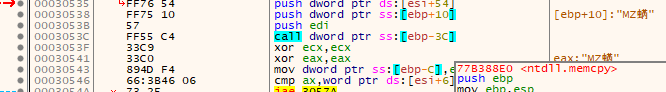
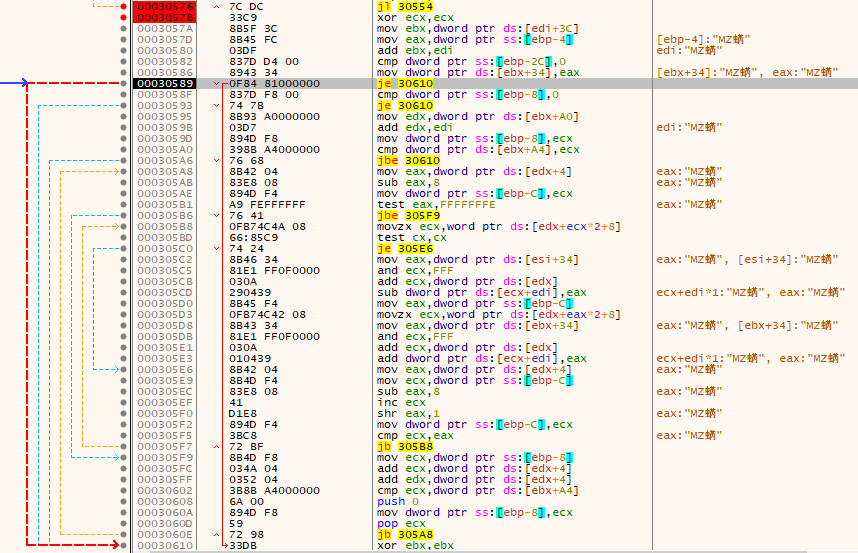
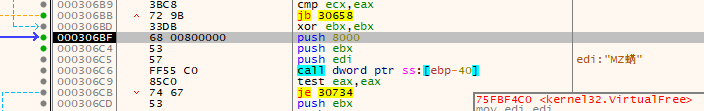
After this is a check that looks like it's either built for multiple possible payloads and the prep for a look that contains additional ntdll.memcpy calls.
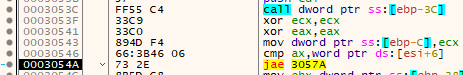
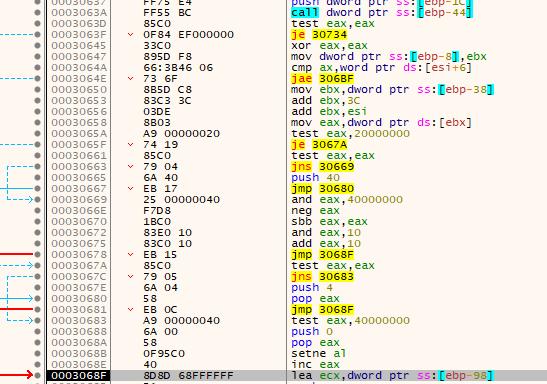
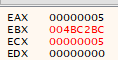
There's a check that compares the value of AX with a word the address within the decrypted code - 0x4BC0DE (hah, "CODE") - that contains the value of 5. However just two instructions ago it nulled out EAX so it fails to jump as zero is not above or equal to 5.
It also zeros out ECX and stores it on the stack. ECX and this storage location on the stack become the loop counter further down.
Next, it pulls a value from the stack into EBX and adds the value ox2C to it followed by the value in the ESI register. The result of these operations is that it loads the value 0x004BC1E4 into the EBX register - an address that is also within the decrypted executable stored at 0x4BC008.

Continuing on, it saves the value of dereferenced EBX subtract 4 onto the stack - the value 0xA600. Next it dereferences EBX directly (value 0x400) and stores that into EAX and then adds the value of dereferenced EBP + 10 (value 0x4BC008). This results in the value of EAX being 0x4BC408 - exactly where the previous ntdll.memcpy call left off.

The last instructions ending in a PUSH that occur before another call to ntdll.memcpy is the load the value of ox001D1000 onto the stack.
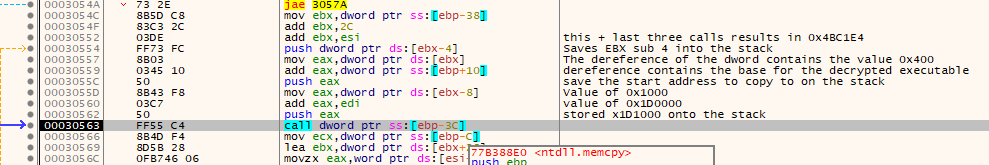
These three pushes make up the parameters of the next ntdll.memcpy call, which results in the parameters of:
| Parameter | Value |
|---|---|
| dest | 0x001D1000 - x1000 bytes into the recently allocated memory. |
| src | 0x004BC408 - Address of where the last call left off. |
| count | 0xA600 |
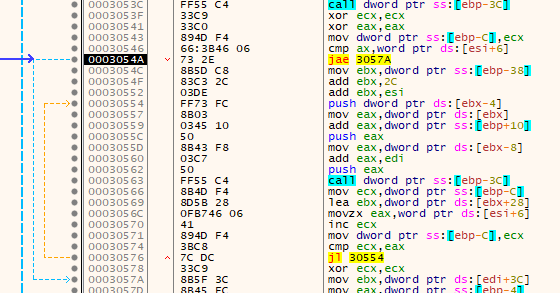
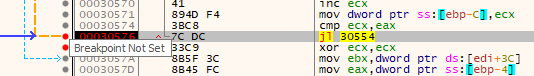
Rather than go through the entire loop step by step for each of the copies, I set some breakpoints and let it loop. The section of loop I didn't cover preps for the next loop and checks to see if it's hit the stopping point. It uses the value of 5 as the stopping point (value was loaded from 0x4BC0DE previously).
These calls move the decrypted executable stored in memory into this second location, though it doesn't move it 1 for 1 as it seems to add some extra space between the first and second calls (about 0x600 bytes).
Note, I set two breakpoints here in case I mess up and don't recognize that the jump isn't going to happen. That way if I accidentally resume the program I don't have to restart and track all the way back down or load a snapshot.
Why these calls: To copy the decrypted executable into what was likely it's original form - it appears it was compressed in some way before it was encrypted. Note, not some substitution compression but rather sections that contained null bytes were removed. This also resolves the TODO: from the kernel32.VirtualAlloc call.
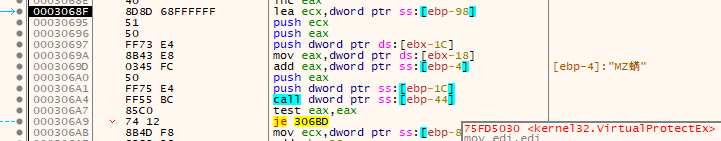
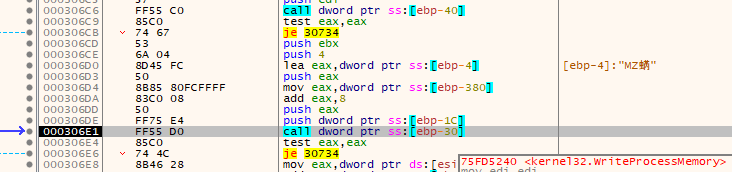
WriteProcessMemory
Immediately after the end of the ntdll.memcpy loop, it stores some values and makes a conditional jump that skips a bunch of other checks/loops:
This drops us directly into a call for kernel32.WriteProcessMemory.
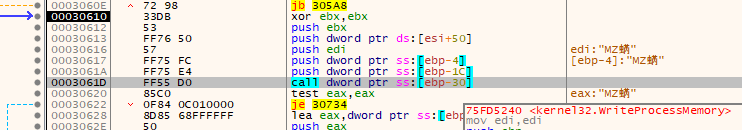
Function Prototype:
BOOL WriteProcessMemory(
  [in]  HANDLE  hProcess,
  [in]  LPVOID  lpBaseAddress,
  [in]  LPCVOID lpBuffer,
  [in]  SIZE_T  nSize,
  [out] SIZE_T  *lpNumberOfBytesWritten
);
Actual Values Passed:
| Parameter | Value |
|---|---|
| hProcess | 0x124 - Process handle token for AppLaunch.exe |
| lpBaseAddress | 0x00400000 - The memory address in the target application that was previously allocated with the kernel32.VirtualAllocEx call. |
| lpBuffer | 0x1D0000 - The decompressed and decrypted stage 2 executable. |
| nSize | 0x12000 |
| lpNumberOfBytesWritten | NULL (0x0) - optional param not used |
Note that at this point I've gone ahead and dumped the second stage again, but this time from the 0x1D0000 address. I know it's spacing/sizing was modified since the last time I dumped it, and what is in this memory page right now is the code that was injected into the target process. If you want more information about how to accomplish this process, check my part 1 post in this series and jump to near the end.
Why this call: This call conducts the actual code injection into the target process. It is writing the decompressed and decrypted stage 2 executable code into the process of another application - in this case AppLaunch.exe.
VirtualProtectEx (multiple)
After the kernel32.WriteProcessMemory call, it checks to make sure it completed successfully.

Next, it immediately begins pushing parameters onto the stack for a call to kernel32.VirtualProtectEx:
Function Prototype:
BOOL VirtualProtectEx(
  [in]  HANDLE hProcess,
  [in]  LPVOID lpAddress,
  [in]  SIZE_T dwSize,
  [in]  DWORD  flNewProtect,
  [out] PDWORD lpflOldProtect
);
Parameter values passed:
| Parameter | Value |
|---|---|
| hProcess | 0x124 - Process handle token for AppLaunch.exe |
| lpAddress | 0x00400000 - Address in AppLaunch where the code was injected. |
| SIZE_T | 0x400 |
| flNewProtect | 0x02 - (PAGE_READONLY) |
| lpfOldProtect | 0x0019FDF8 |
I'm not entirely sure what is at lpfOldProtect address being passed, however it's certainly the old protection value that was stored on the stack, possibly within a struct.
Next, it passes a series of checks, skipping some jumps down to a call to kernel32.VirtualFree.
Immediately after these checks is the prep for another call to kernel32.VirtualAllocEx.
Actual parameters passed:
| Parameter | Value |
|---|---|
| hProcess | 0x124 - Process handle token for AppLaunch.exe |
| lpAddress | 0x00401000 - Address in AppLaunch where the code was injected. Note this time it is the 0x1000 offset that was used in the second ntdll.memcpy call. |
| SIZE_T | 0xA520 |
| flNewProtect | 0x20 - (PAGE_EXECUTE_READ) |
| lpfOldProtect | 0x0019FDF8 |
This second call is giving the executable section of the injected PE the execute and read flag.
However, next up it enters a loop - for a count of 5. It seems it's going to fix the permissions the same way it copied data into the 0x001D0000 location in memory.
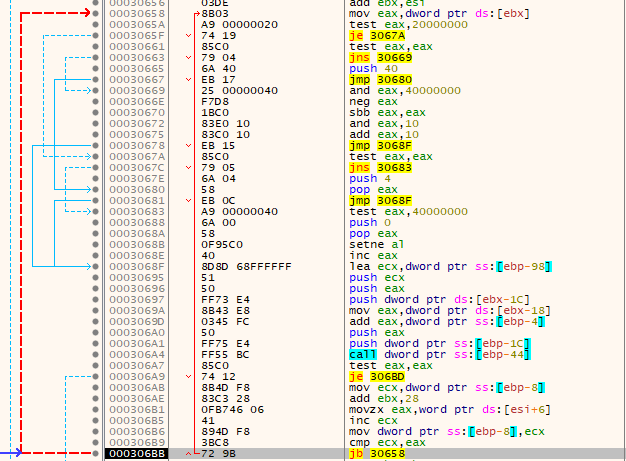
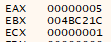
Here's the values of EAX and ECX in that CMP instruction before the conditional jump.
Just like with the ntdll.memcpy calls that these are mirroring, I'm going to jump to the end of the loop.
Why these calls: These calls set the proper memory permissions that an executable should have. The secondary ones within the loop are particularly important to do so Data Execution Prevention (DEP) isn't triggered when the hollowed/injected process is resumed.
VirtualFree
After the loop is the prep and a call to kernel32.VirtualFree.
The function prototype:
BOOL VirtualFree(
  [in] LPVOID lpAddress,
  [in] SIZE_T dwSize,
  [in] DWORD  dwFreeType
);
Actual parameters passed:
| Parameter | Value |
|---|---|
| lpAddress | 0x001D0000 - Location of properly built decrypted and decompressed stage 2 executeable. |
| SIZE_T | NULL (0x0) |
| dwFreeType | 0x8000 (MEM_RESET) |
Note that the dwFreeType is MEM_RESET. From the docs linked in the table:
Indicates that data in the memory range specified by lpAddress and dwSize is no longer of interest. The pages should not be read from or written to the paging file. However, the memory block will be used again later, so it should not be decommitted. This value cannot be used with any other value.
Using this value does not guarantee that the range operated on with MEM_RESET will contain zeros. If you want the range to contain zeros, decommit the memory and then recommit it.
I'm not quite entirely sure exactly why this free type is being used, however I was able to confirm that it appears to no longer be mapped within the malware process:
Why this call: This call isn't critical to the process hollowing procedures and could be skipped. I am 99% sure it is done to hide the memory page from anyone who comes along to analyze the crash that occurs in the malware after the process hollowing is complete.
Note: If you don't recall the crash I'm talking about, once again head back to part 1 and check near the middle for where the application crashes on me while I was observing kernel32.LoadLibrary calls.
WriteProcessMemory (again)
After the kernel32.VirtualFree call and a check to make sure it executed successfully is another call to kernel32.WriteProcessMemory. This time it is likely fixing up something in memory before resuming the suspended and injected AppLaunch.exe instance.
Rather than having you scroll up to find it again, here's the function prototype a second time:
BOOL WriteProcessMemory(
  [in]  HANDLE  hProcess,
  [in]  LPVOID  lpBaseAddress,
  [in]  LPCVOID lpBuffer,
  [in]  SIZE_T  nSize,
  [out] SIZE_T  *lpNumberOfBytesWritten
);
Parameter values passed for this call:
| Parameter | Value |
|---|---|
| hProcess | 0x124 - Process handle token for AppLaunch.exe |
| lpBaseAddress | 0x04C46008 - PEB value of process base address |
| lpBuffer | 0x0019FE8C - Contains the value of 0x00400000 |
| nSize | 0x4 - A DWORD |
| lpNumberOfBytesWritten | NULL (0x0) - optional param not used |
If you recall from before, 0x04C46008 is the 5th parameter of the PEB in the suspended (and now injected) AppLaunch process. This time I am going to make you scroll up if you want to see it.
Why this call: This call will change the process base address within the AppLaunch.exe's PEB to point to the newly injected PE's base address of 0x00400000.
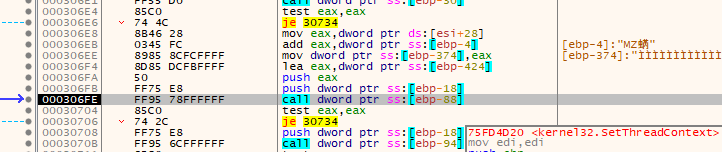
SetThreadContext
Following the trend from the last function call, next is kernel32.SetThreadContext. This is going to change the value of EAX within the suspended process to the proper entry point for the injected code.
As noted before near the beginning of this post, when the process is resumed and actually begins execution the value in EAX will become the first value for EIP.
Function Prototype:
BOOL SetThreadContext(
  [in] HANDLE        hThread,
  [in] const CONTEXT *lpContext
);
In this case, I'm going to throw in the CONTEXT structure prototype as well... but oh wait, I wasn't able to find the correct prototype for it. Going to have to go a little blind with this one, but I know what it should be doing.
It's modifying the CONTEXT structure that was created previously with the kernel32.GetThreadContext call at the beginning of the "Actual Analysis" section of this post. The value it sets at the offset that I think is 0x50 within the context structure is 0x0040779C.
Actual parameters passed:
| Parameter | Value |
|---|---|
| hThread | 0x120 - the handle for the primary (and should be the only thread right now) in the suspended AppLaunch.exe isntance. |
| lpContext | The CONTEXT structure created previously in the kernel32.GetThreadContext call, modified with a single DWORD difference that should result in a change to EAX. |
Why this call: This call is setting up the new entry point for the suspended process so that when it is resumed the injected code is executed.
ResumeThread
The last function call covered in this post - and technically the end of the process injection/hollowing procedures - is kernel32.ResumeThread.
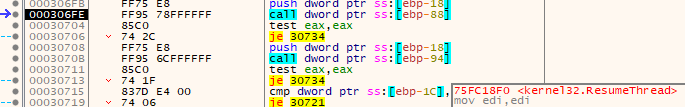
Rather than go through the prototype and values passed to a function that only takes a single parameter that you should've already guessed, I'll just write it out. It's resume the thread with the thread handle token of 0x120 - the primary thread of the AppLaunch.exe process.
End of Part 3
Is that even process hollowing?
So this is interesting - the shellcode in this malware was fully and 100% prepared for process hollowing, however it never actually unmapped the existing processes memory. It would have unmapped the existing program if it's code conflicted with it's injection target address of 0x00400000, but it didn't need to.
I'm not actually sure this technically qualifies as process hollowing and not some other flavor of process injection. It's not Portable Executable Injection(T1055.002), as the ATT&CK framework states that particular method creates a new remote thread. A closer sub technique of process injection is Thread Execution Hijackin(T1055.003) - though that one is still listed as needing to unmap memory of the existing process's executable code... However thread hijacking is targeted at existing processes.
The ATT&CK framework lists 12 separate process injection techniques, and looking through them I can't find one that's a better fit than process hollowing, even though it technically never unmapped the memory of the other process.
I'll have to do some more searching, but for now I'm still comfortable calling this Process Hollowing. If there had been an address conflict it would have fulfilled all the requirements to earn the name.
Part 4 should be the last part - I'll finish up with this process and move over to the injected AppLaunch.exe process to analyze. From the original MalwareBazaar post, there was a tag for cobalt strike (because of course it is).
(For a couple reasons, I'm not finishing this series. It is, in fact, NOT cobalt strike. Go take a look for yourself!)
(Also I did pass OSED, so congrats to me from me I guess)